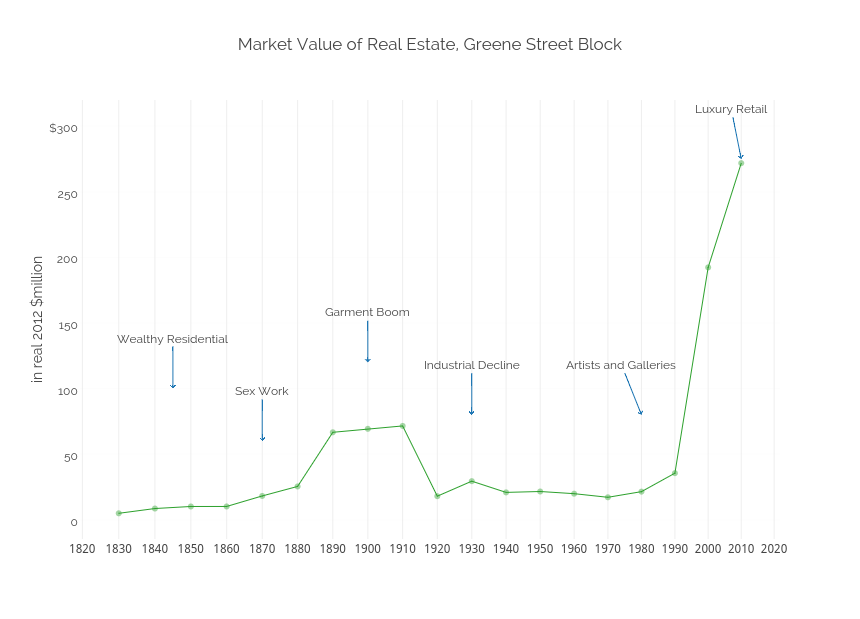
This chart of real estate values in real 2012 million dollars shows the volatility, the dips and spikes in the chaotic history of the Greene Street block. Read more about the crash after the garment boom or the rapid rise of luxury retail on Greene Street.
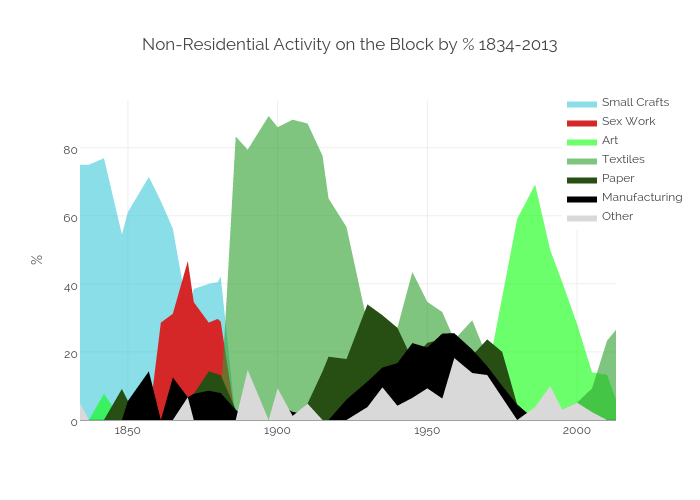
This chart reveals some of the major spikes in non-residential activity on the block: a brief spike in sex work, followed by the garment boom, and later the art takeover. The values are in % of total non-residential land use on the block.
Occupational Shares of Residents on the Block 1834-1881

This chart reveals the quick drop in residents who were merchants and educated professionals. By the 1860s, those engaged in sex work and alcohol-related work, along with manufacturing and unskilled labor, took their place. Read more about the residential period of Greene Street or the entertainment district of the brothel era.
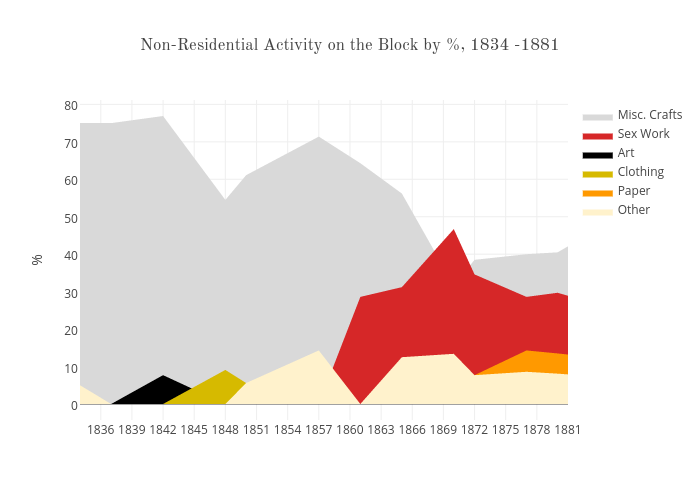
This area plot reveals the spike in sex work during the mid and late 19th century. In 1870, Greene Street had the highest concentration of brothels in New York City. Read more about brothels.
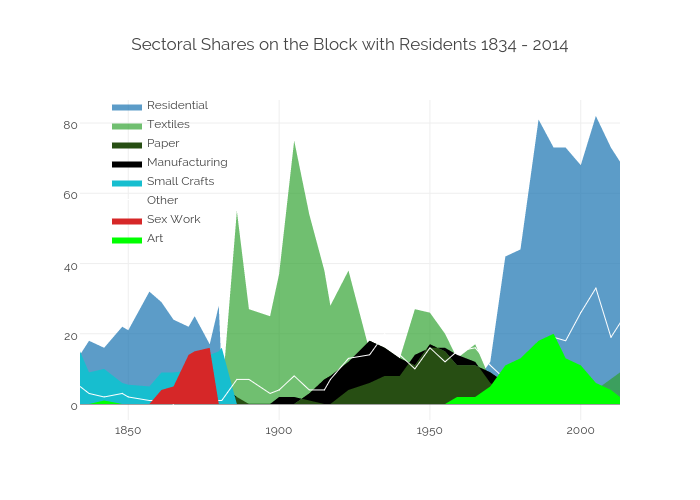
This chart shows the number of addresses on the block engaged in different sectors, including residential living. The two residential periods on Greene Street are made clear: the wealthy residents of the 1830s-1880s, and the wealthy residents of today. The chart also clearly reveals the total drop in housing and the large number of garment factories in the late 19th and early 20th centuries.